

Dashboards
Historic SARS-CoV-2 wastewater data (SEEC-SLU)
Historic Data last updated:
The data presented on this page is no longer updated but remains available for historic reference.
The data presented on this page was generated in the SLU (Swedish University of Agricultural Sciences) laboratories of SEEC (Swedish Environmental Epidemiology Center). The project was part of SciLifeLab’s Pandemic Laboratory Preparedness (PLP) Program, led by Anna J. Székely (Department of Aquatic Sciences and Assessment, SLU). Wastewater analyses were overseen by Anna J. Székely and Maja Malmberg (Virology Unit of the Department of Biomedical Science and Veterinary Public Health, SLU). This page describes the historic quantification of SARS-CoV-2 levels in wastewater across multiple Swedish cities. The project achieved the broadest geographic coverage across Sweden, covering data for approximately 43% of the Swedish population.
Please note that the data and visualisations on this page are historic snapshots. The scores in the datasets and plots below are final, although minor corrections may have been applied retrospectively. This dashboard serves as a record of the project’s results during the active monitoring period.
Wastewater collection sites
SLU-SEEC collected and analysed samples from multiple wastewater treatment plants (WWTP). The table below summarises the monitored towns and cities, associated WWTPs, estimated population sizes for each catchment, and the start and end dates for monitoring. Values marked with an asterisk (*) indicate BOD-7 estimates rather than the exact number of connected residents. A copy of the table is also available as an Excel download.
Visualisations
Important note: Historical data for Ekerö, Enköping, Knivsta, Tierp, Vaxholm, Älvkarleby, and Österåker remain available in the dataset but are not displayed in the plot below.
While identical laboratory methods were used across sites, differences in wastewater collection systems and population sizes can bias direct comparisons between localities.
How to use the interactive features of the plot
View data from particular sites: Double-click a site name in the legend to focus on a single site. Single-click to toggle a site on or off. Use the Deselect all areas and Reselect all areas buttons to quickly adjust the selection.
Adjust axis ranges: Click and drag to define a rectangle across the axes to zoom in on a specific time window or value range.
Inspect exact values: Hover over a data point to show a tooltip with the precise values for all sites on that date.
Additional plot controls: Use the toolbar in the top-right corner of the plot to zoom, autoscale, or reset the axes.
The data underlying this visualisation is available for download.
Commentary from the research group
Date: 2024-03-20
Commentary: An error occurred during the processing of the data for week 11 of 2024 due to a normalisation issue. Consequently, the SARS-CoV-2 data appeared to be 16 times higher and the influenza A data 4 times higher than their actual values. The error was identified and corrected the following day while the official report was being prepared, and the website was promptly updated. The research group apologises to anyone alarmed by the inaccurate results.
Reports from the research group
Summaries of the findings are available as downloadable reports. The most recent archived version, in Swedish, is available here.
Dataset
Contact: anna.szekely@slu.se and javier.vargas@slu.se
The respiratory-virus gene-copy dataset spans week 38 of 2020 onward. Use the Download data link beneath the national figure to download the CSV.
How to cite the dataset: Székely, A. J., Malmberg, M., Vargas, J., Mohamed, N., Dafalla, I., Petrini, F., Davies, L. (2023). Dataset of SARS-CoV-2, influenza A and influenza B virus content in wastewater samples from wastewater treatment plants in Sweden. https://doi.org/10.17044/scilifelab.14256317.
How to cite the method: Isaksson, F., Lundy, L., Hedström, A., Székely, A. J., Mohamed, N. (2022). Evaluating the Use of Alternative Normalization Approaches on SARS-CoV-2 Concentrations in Wastewater: Experiences from Two Catchments in Northern Sweden. Environments, 9, 39. https://doi.org/10.3390/environments9030039.
Methods
For most cities, raw untreated wastewater samples that represent a single day were collected using flow-compensated samplers at the WWTP. Uppsala was the exception: since week 16 of 2021, daily samples were combined flow-proportionally into one composite weekly sample for analysis.
Collected samples were processed according to standard methodologies. For samples collected up to and including week 18 of 2021, viral particles were concentrated using the electronegative filtration method (Ahmed et al., 2020). From week 19 of 2021 onwards, viral genomic material was concentrated and extracted via the direct capture method using the Maxwell RSC Enviro TNA kit (Promega).
Absolute quantification of SARS-CoV-2 copy numbers was performed using One-Step RT-qPCR. Until week 31 of 2023, viral genomes were quantified using the SARS-CoV-2 specific N1 assay from the Centers for Disease Control and Prevention. From week 32 of 2023, the Flu SC2 Multiplex Assay was applied. To correct for variation in population size and wastewater flow, pepper mild mottle virus (PMMoV) was quantified using a modified version of the assay from Zhang et al. (2006). PMMoV is an abundant RNA virus in human faeces and serves as an estimator of human faecal content (Symonds et al., 2019). Further details are available in Isaksson et al. (2022).
The graph and data file present the ratio of copy numbers measured by the Flu SC2 Multiplex Assay and PMMoV assays, multiplied by 1000. This ratio can be considered a proxy for the prevalence of COVID-19 infections in the wastewater catchment population. Older data were transformed using conversion factors estimated from alignment periods when old and new methods were used in parallel.
Historic wastewater data for Umeå and Örebro
This section displays the amount of SARS-CoV-2 in Umeå and Örebro wastewater between October 2020 and June 2021. A new method was used after June 2021, and more recent data can be found on the active SLU wastewater dashboard.
The data were collected as part of a research project led by associate professor Maja Malmberg at SLU (maja.malmberg@slu.se), in collaboration with the SciLifeLab COVID-19 National Research Program and associate professor Mette Myrmel at the Norwegian University of Life Sciences.
Samples were collected from wastewater treatment facilities in Umeå and Örebro. See the catchment area maps for Umeå and Örebro. Viruses were extracted using ultrafiltration and analysed using qPCR for SARS-CoV-2 RNA. Primers previously used and verified by Corman et al. (2020) were used to detect SARS-CoV-2, and qPCR samples were normalised against pepper mild mottle virus. Up to January 2021, three samples were taken from each facility per week and pooled into a weekly estimate. Samples were collected weekly after January 2021.
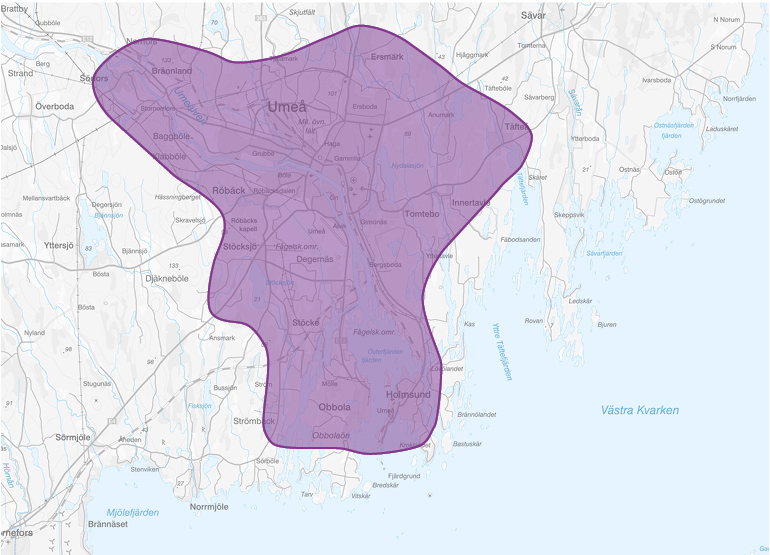
In the plots below, the amount of SARS-CoV-2 for each week is shown relative to the amount measured on 6 November 2020.
Amount of SARS-CoV-2 in Umeå wastewater (October 2020–June 2021)
Download the data: Gene copy number change relative to 6 November 2020 and flow level at each measurement (Excel). Data are available from week 44 of 2020 until week 22 of 2021.
How to cite: Malmberg, M., Myrmel, M. & Khatri, M. (2021). Dataset of SARS-CoV-2 in wastewater in Umeå, Sweden. https://doi.org/10.17044/scilifelab.14376881.v1.
* Data for these weeks is not available.
** Samples were stored at +4 °C for 2–3 weeks, unlike all other samples.
Amount of SARS-CoV-2 in Örebro wastewater (October 2020–June 2021)
Download the data: Gene copy number change relative to 6 November 2020 and flow level at each measurement (Excel). Data are available from week 44 of 2020 until week 22 of 2021.
How to cite: Malmberg, M., Myrmel, M. & Khatri, M. (2021). Dataset of SARS-CoV-2 in wastewater in Örebro, Sweden. https://doi.org/10.17044/scilifelab.14377097.v1.
* Data for these weeks is not available.
** Samples were stored at +4 °C for 2–3 weeks, unlike all other samples.